Speaker Notes: “Unlock the Power of Heatmaps: Super Charge Your SEO and UX Strategy” #brightonSEO
更新日: 2024.11.11 公開日:2024.04.15シェアする


In September 2023, Kenichi Suzuki and Rio Ichikawa from our company participated and presented at BrightonSEO, the largest SEO conference in Europe. In this article, you’ll find the speaker notes and slides from their speech: “Unlock the Power of Heatmaps: Supercharge Your SEO and UX Strategy”.
About Us
We’re a leading digital marketing solution provider based in Tokyo, popularly known for its cutting-edge SEO platform “Mieruca”. Since our founding in 2005, we’ve helped businesses across Japan drive growth through innovative, data-driven strategies. With over 1,800 direct enterprise clients, our strengths lie in powerful sales and marketing capabilities combined with advanced software development prowess. Our team of seasoned professionals specializes in search engine optimization (SEO), conversion rate optimization (CRO), and web analytics.
Must-read: “The Ultimate Guide to Nailing SEO in 2024”
Check out the most-read article by our SEO specialist, Komaru, explaining the latest SEO strategies for ‘SEO that delivers results’.
Speakers
Faber Company Inc. Director/ Search Advocate
Kenichi is a highly experienced SEO, entitled as an official Google Product Expert. He leads SEO initiatives as Search Advocate at the Faber Company in Tokyo. His personal SEO blog reigns as Japan’s top resource.

Faber Company Inc. Web/Software Development PM
Based in Japan, Rio is an accomplished product manager specializing in CRO and UI/UX. She has excelled in optimizing website conversion rates for numerous clients using tools like heatmaps and Google Analytics.
↓ Now let’s dive right in ↓
Unlock the Power of Heatmaps: Supercharge Your SEO and UX Strategy
Kenichi:Good evening everyone. My name is Kenichi Suzuki.
Rio:My name is Rio Ichikawa. We’re pleased to join you today from Faber Company based in Tokyo. Kenichi is a renowned SEO expert, and I’m specialized in UX and CRO.

Rio:Since BrightonSEO is a SEO conference, what am I doing here as a UXer?
Kenichi:Well, that’s a good point. Let’s think this through…what do you think is the ultimate goal of SEO?

Rio:Hmm…getting high rankings in search?
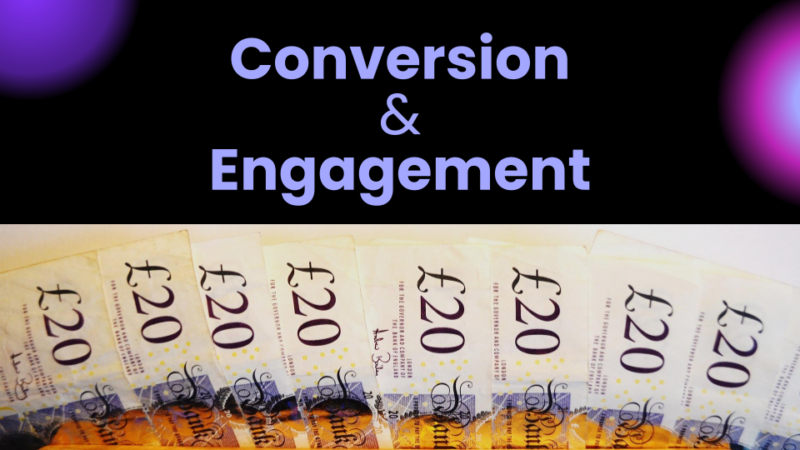
Kenichi:For sure, rankings matter. But that’s not exactly the purpose. SEO is ultimately about increasing conversions and engagement on your site – in short, generating more money.
Rio:Ah I see, so in order to successfully optimize your website, you need both good SEO and UX.
Kenichi:Exactly! Having a website that ranks highly but has poor UX is pointless. We need both good UX and good SEO for creating user experiences that perform well in search. Does that make sense?
Rio:That makes total sense! Great UX is also critical to increasing conversion and user engagement. Then I guess I deserve to be here.
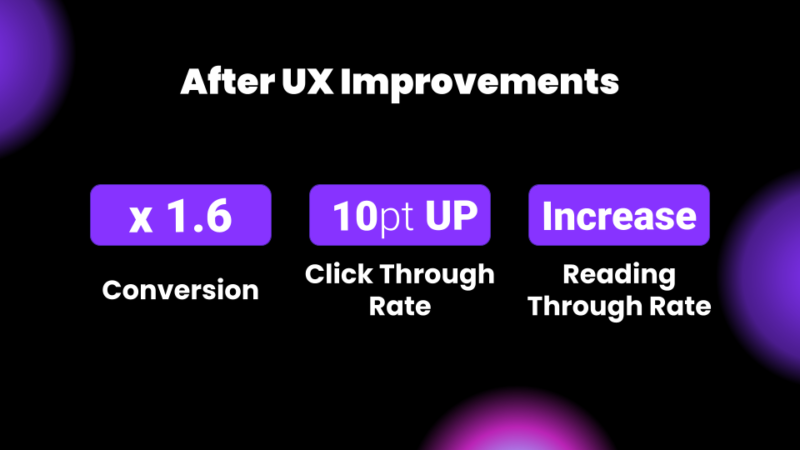
Kenichi:At Faber Company, we’ve improved UX for 20 years. We’ve seen conversions go up by 1.6 times, click-through rates increased by 10 points, and people reading through more content. UX is something that can be improved strategically. Rio, I know you worked on many of UX wins we had. What did you do to make them happen? Can you share some of your strategies?
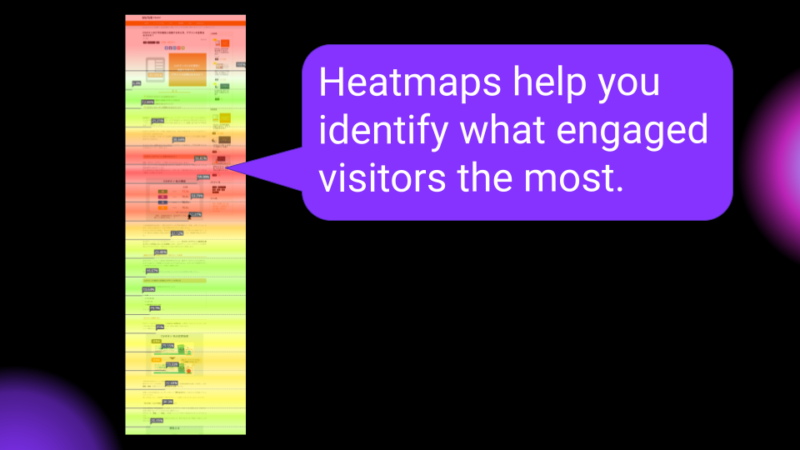
Rio:Absolutely! There’s this one tool I always rely on when creating a better UX, Heatmaps. Heatmaps help you visualize how people are engaging with the content on your pages. Heatmaps help you optimize your webpages based on the real users’ behaviors, leading to getting more conversions and satisfying your users.
3 Main Features of Mieruca Heatmap
Kenichi:I heard our heatmap tool has 3 main features. Can you walk through what they are?
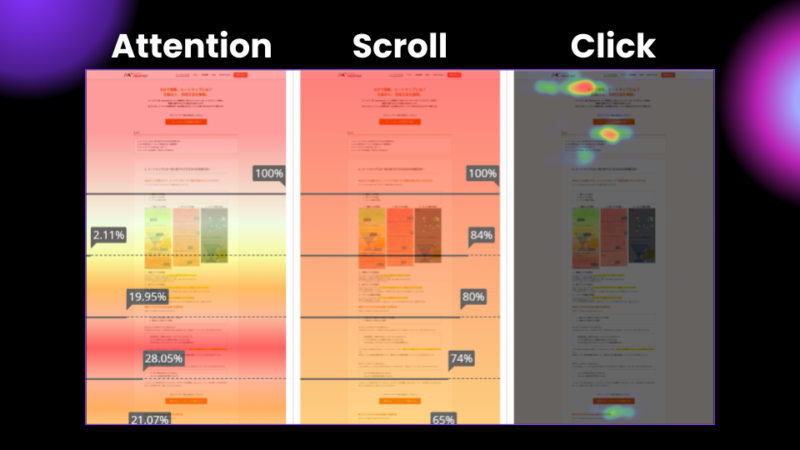
Rio:Absolutely. There are 3 main features. One is Attention Heatmaps, also known as Read Heatmaps. Another one is Scroll Heatmaps, and the last one is Click Map. Let me explain one by one. Attention Heatmap visualizes which section of the page the users are reading and engaging the most. So by using the Attention Heatmap, you can see which part of your page are getting more attention. Moving onto Scroll Heatmap. Scroll Heatmap visualizes how deep the users have scrolled down the page. So by using this, you’ll be able to figure out at which section of the page the users have lost interest and left the page. The last one is, Click Heatmap. Click Heatmap is very simple. It shows you which part or element of the page are clicked by users. You can use this heatmap to figure out if the elements on the page are being clicked as expected.
Case Study 1: ABC-MART
Kenichi:Thanks, Rio. Now, moving onto our first case study: ABC-MART ecommerce website. ABC Mart is a leading shoe retailer in Japan. By using the heatmaps, they were able to increase their conversion rate significantly.
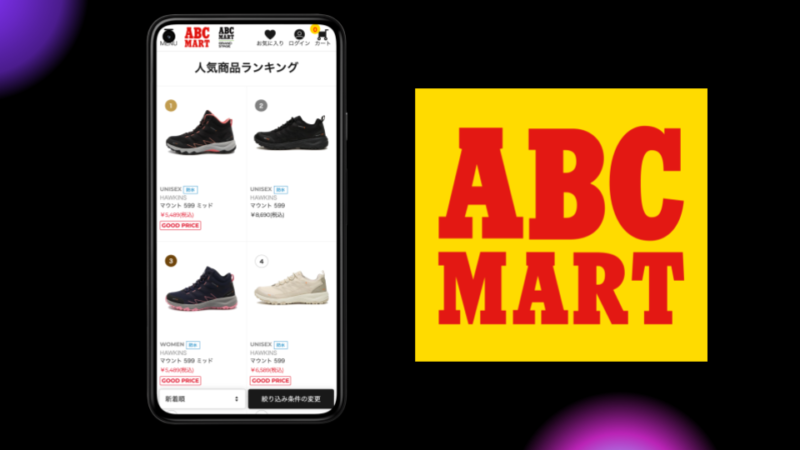
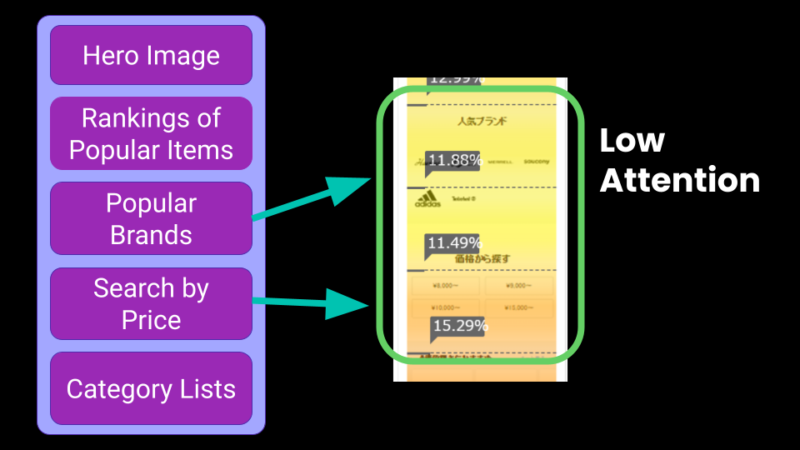
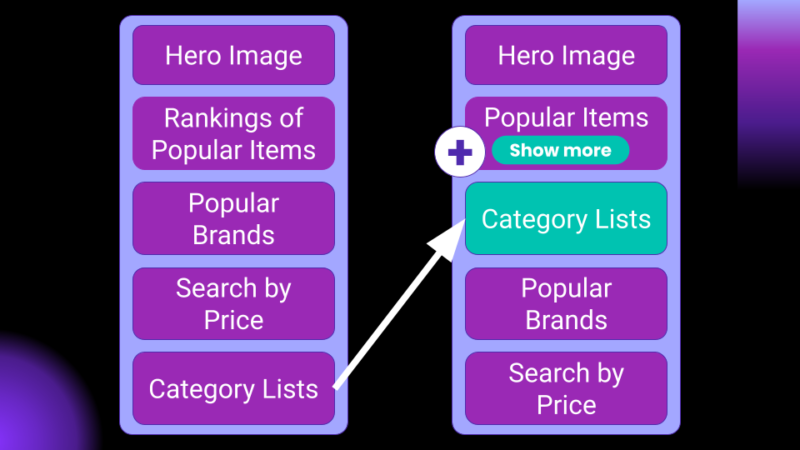
Kenichi:This is a product listing page for trekking shoes. On the left, you can see that the page has a hero image, rankings of popular items, popular brands, search by price, and category lists presented from top to bottom. On the right, you can see Attention Heatmaps, which indicate the areas that received the most attention. So Rio, how did your team analyze the heatmap data in the redesigning process?
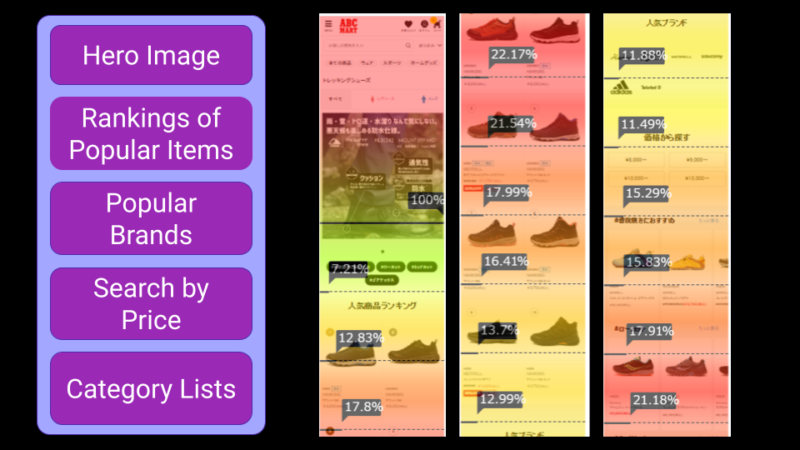
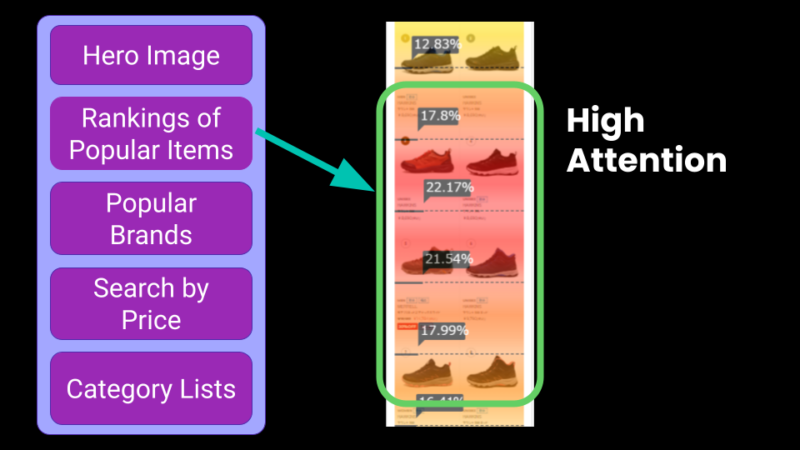
Rio:Let me explain – first, let’s take a look at the heatmaps data for each section. There’s a popular items section right below the hero image. You can see that data point is high and showing red for this section. That means popular items section is getting more attention. Let’s take a look at the next section.
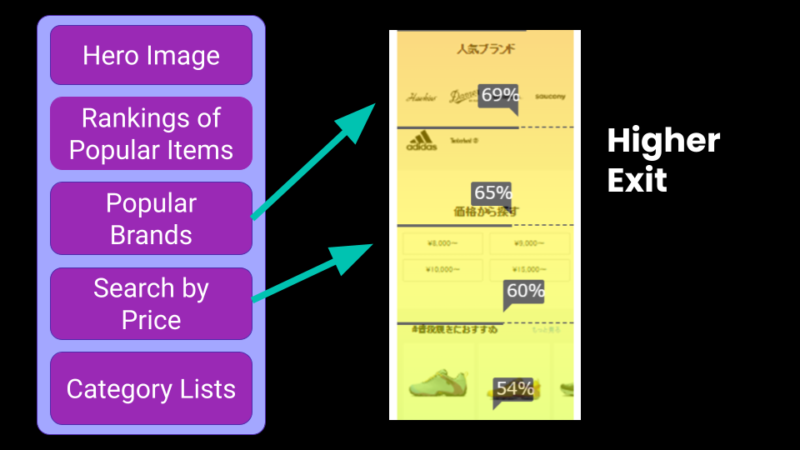
Rio:As you can see, Popular Brands, which only displays the brand logos, is showinf lower data points and a cooler tone compared to the previous section. Same thing can be said to Search by Brand section. These sections are leading to the high exits. Now it’s obvious that the page visitors aren’t really interested in Popular Brands and Search by Brand section.
Rio:So now we’re at the buttom of the page. As you can see, there’s a category list. Usually, users lose interest towards the end of the page. But when you take a look at this, you can see that the section is surprisingly catching more attention.
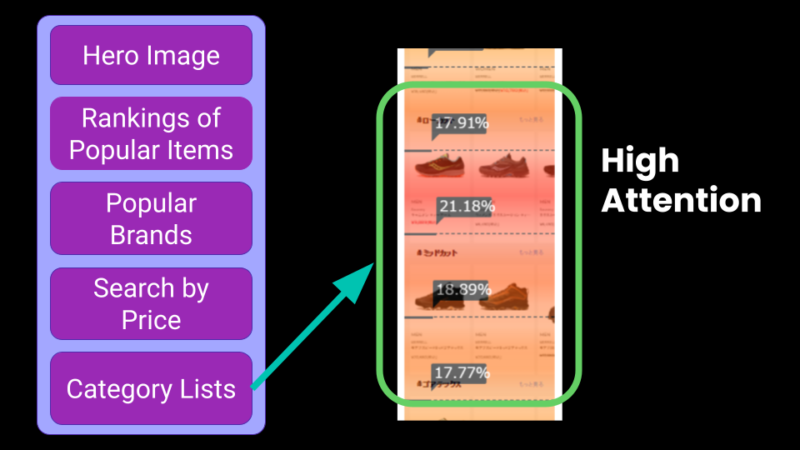
Kenichi:Thanks, Rio. Let me recap your key findings. Visitors showed substantial interest in the Popular Item section at the top of the page. They also spent a lot of time engaging with the product category lists, despite them being positioned at bottom. However, the popular brands and search by price filter were mostly ignored.
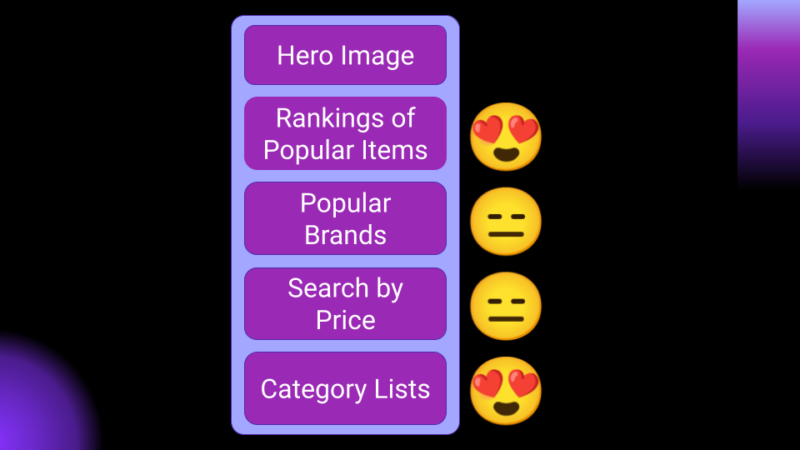
Rio:Based on those heatmap insights, we came up with some hypotheses. First hypothesis is “Visitors who are interested in popular items want to directly browse popular items”. Second hypothesis is “Potential CV users want to see items by categories, rather than by brands or pricing”.
Rio:Based on these 2 hypothesis, we came up with action items. First, we placed a [Show more] button below the popular items, so that users can easily start browsing products. We also moved the category list higher up in the page so more users can interact with the section and prevent withdrawals.
Kenichi:So what happened after you made those tweaks? Any good results?
Rio:Great news, the newly inserted CTA [Show More] button managed to gain a lot of clicks! We also saw a major improvement on the scroll heatmap too.
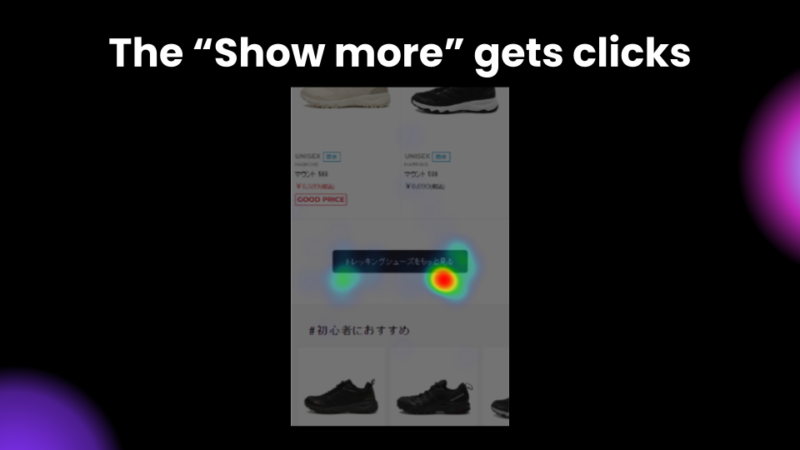
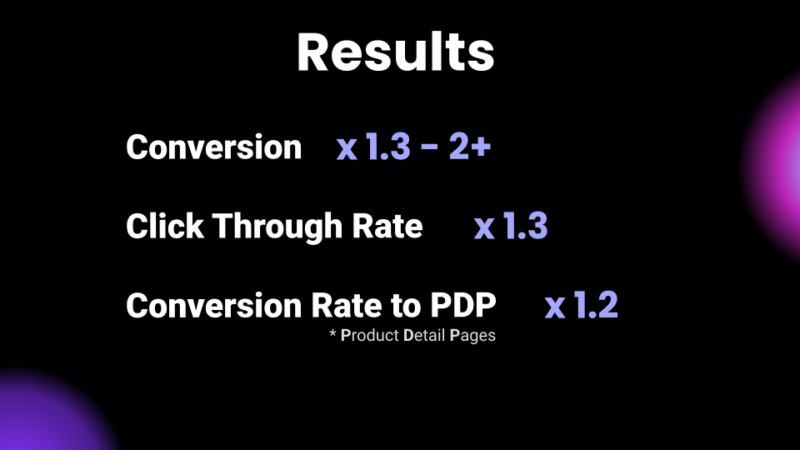
Rio:Because of the changes, it succeeded in getting the site visitors to scroll the page much deeper, leading to a lower withdrawal rate. We also saw huge improvements in terms of CVR, CTR, and PDP transition rate..
Kenichi:Sweet! Now I get why heatmaps are so useful.
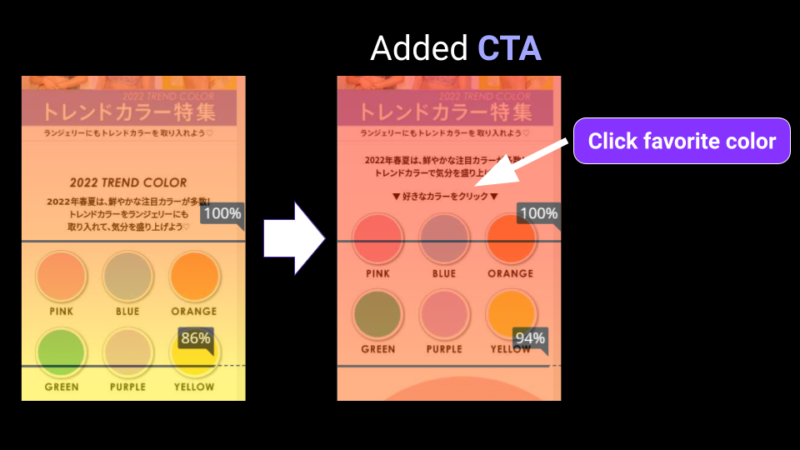
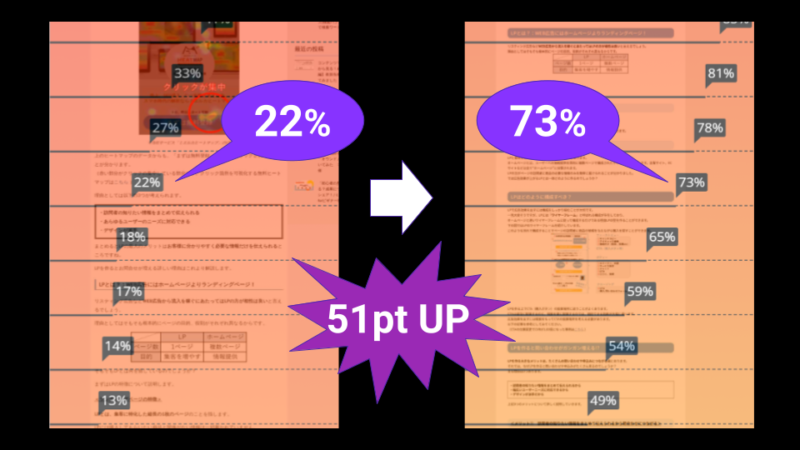
Case study 2: aimerfeel
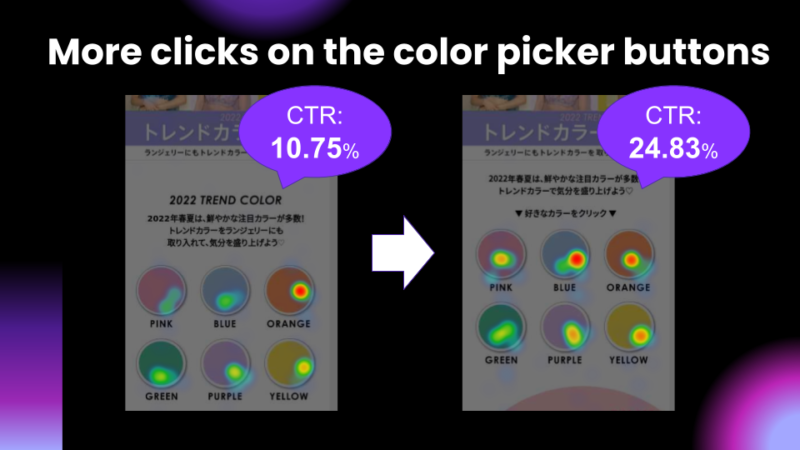
Rio:I have another case study to share. aimerfeel is a langerie ecommerce website in Japan. We updated their page layout utlizing heatmaps, and we successfully increased the Click Through Rate on the website by over 10 point.
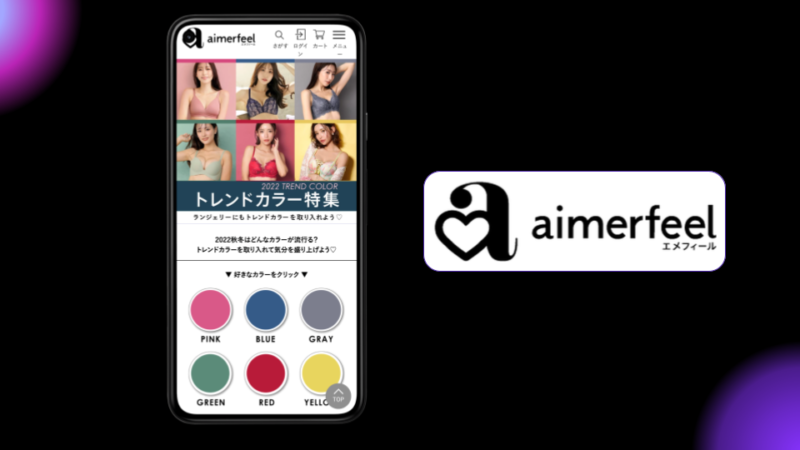
Rio:So this page introduces popular page by popular colors. Just below the fold, the colors are listed as buttons. If you click any of these buttons, it will scroll down to the section of the chosen color.
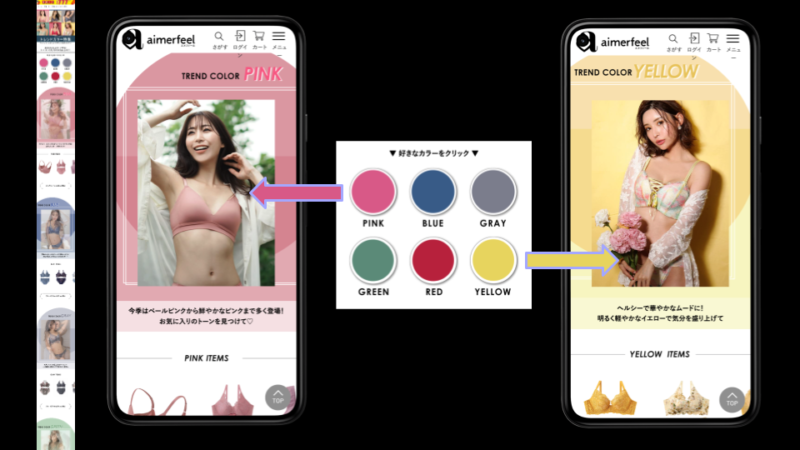
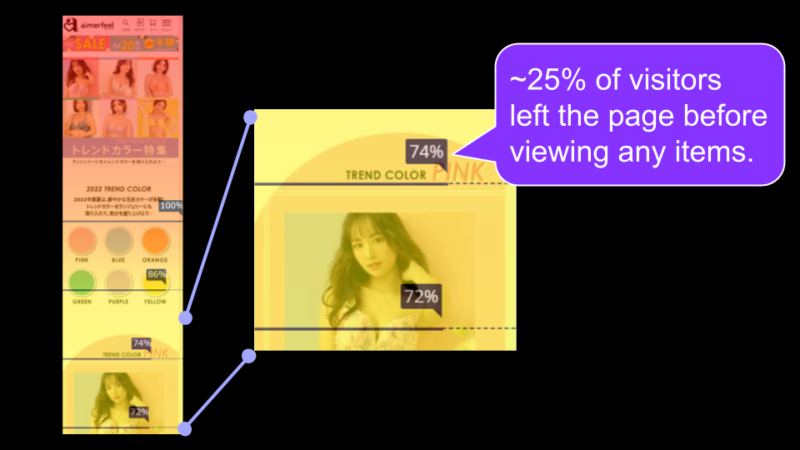
Rio:Let’s take a look at the Scroll Heatmap. You can see that around 25% of the users have left the page even before reaching the main content area.
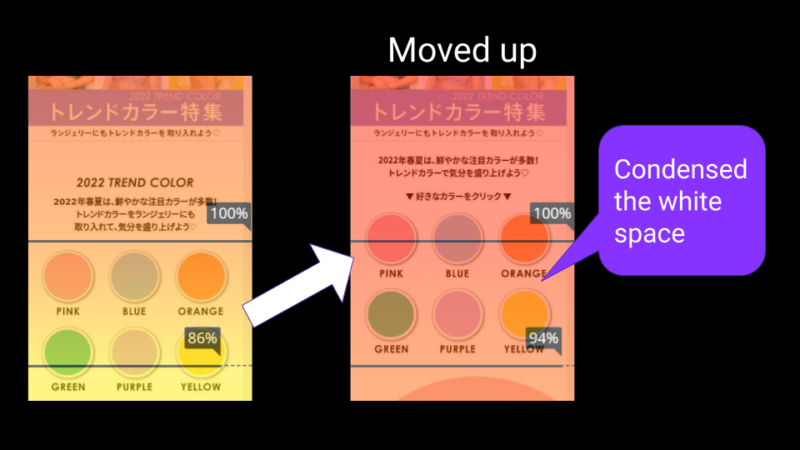
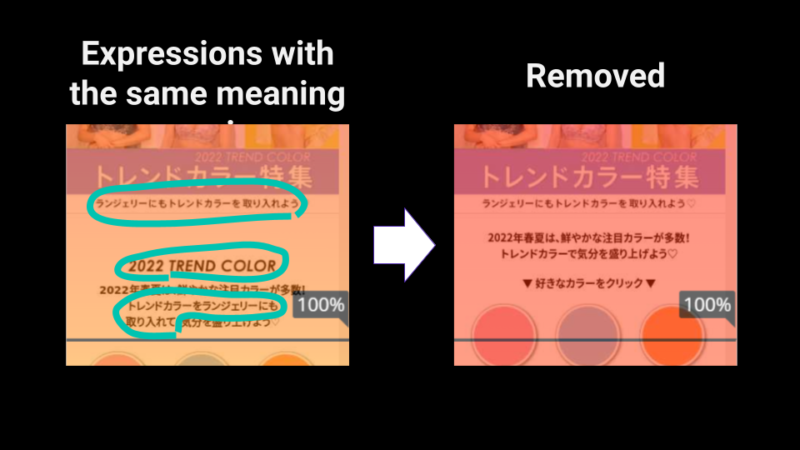
Rio:Based on this data, we came up with hypothesis. First hypothesis is, redundant text is causing visitors to lose focus. Second one is, the Color Picker button at the top might’ve not recognized as a clickable element. The third one is, rather than seeing the hero image, visitors want to start browsing the list of products right away.
Rio:So based on these hypothesis, we created action items. First, we removed the redundant and repetitive text. Next, we added text-based CTA to make it clear that the color picker buttons are clickable. Last one, we moved the color picker buttons to a higher position so that the viewers can view the products more quickly.
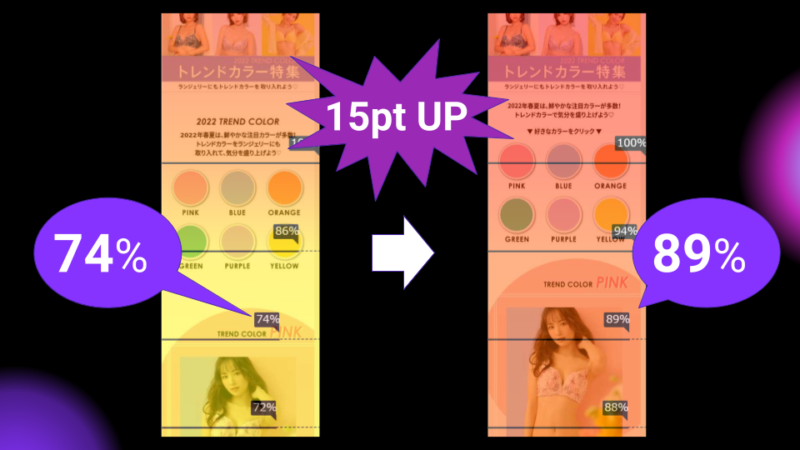
Rio:After making all those changes, the CTR of this page doubled up. On top of that, the Scroll rate of this page went up by 15 point. Overall CTR on the page also increased by 10%.
Kenichi:The results your team achieved are truly remarkable. By optimizing the UI through heatmap analysis, you enabled more visitors to successfully find and shop their desired products. Now, could you share some tips on utilizing the heatmaps more effectively?
Tips on utilizing heatmaps
Rio:Sure, let me share some tips with you when using the heatmaps. First tip: when you use Scroll Heatmap, make sure to audit the above-the-fold content. So if you find a fold with higher points, investigate areas above the fold. Second tip is, use the Attention Heatmap or so-called Read Heatmap to look for red areas. And if you find these sections, leverage them. In turn, if you find areas that aer getting lower attention, simply remove them or shorten the section to reduce withdrawal rate.

Kenichi:Today we’ve shared 2 e-commerce case studies demonstrating how heatmaps can help achieve higher conversion rate and user engagement. I also want to highlight that heatmaps are also incredibly helpful for optimizing article pages, especially for lengthy pages.
Heatmaps for Articles
Kenichi:This page on my company’s blog, for example, is ranking number one for a highly competitive keyword, yet heatmaps revealed that only 20% of visitors read the article til the end.
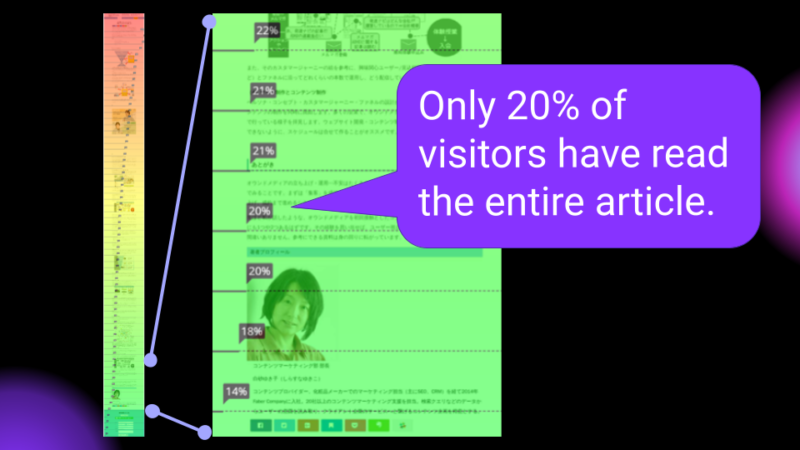
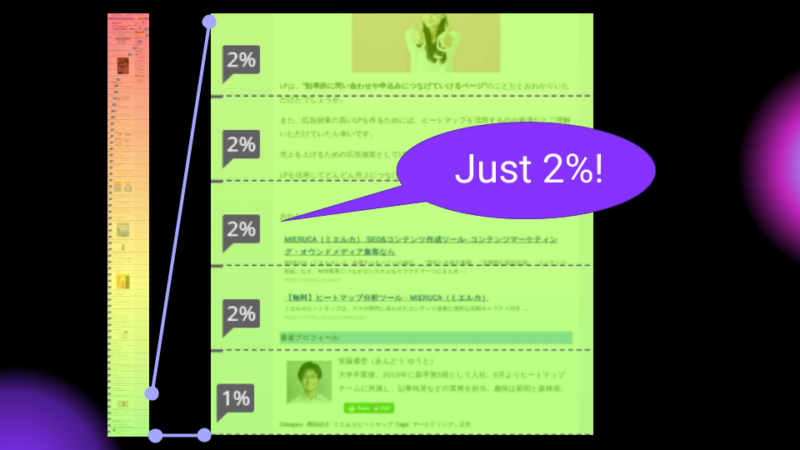
Kenichi:As you can see, this article is quite long. The issue was visible on another blog post as well, where heatmaps revealed that only 2% of the site visitors reached the final paragraph. While we achieved high rankings, users did not engage with our content.
Kenichi:Let me ask you all…do you usually read articles word-for-word? There’s no way. ChatGPT is the epitome of this trend. People these days don’t read, but they skim and skip. So how can we encourage readers to fully engage with our articles from start to finish?
Kenichi:This is where heatmaps come in. From here, Rio will take over and share how to leverage heatmaps to optimize engagement for articles.
Rio:As many of you said you don’t read articles in their entirety, attention heatmap data also shows that. As you can see, the number goes up when the visual contents such as images, graphs etc. are inserted, but the number goes down when the text is too long. So not only the heatmap helps you identify the parts on your page that people are engaging, but it also helps you identify the parts that people are disengaged.
Heatmap for articles – In Case of Our Company Blog
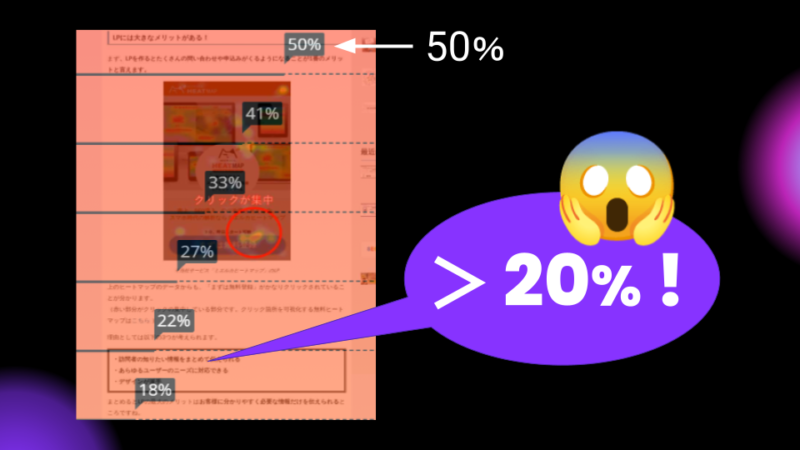
Rio:Here’s an article from our blog. When I looked at the Scroll Heatmap for this page, I was shocked. Half of the visitors have left the page before reaching the main content area. Imagine you put a lot of effort on SEO or spend a lot of money on pay-per-click to gain the visitors, but half of them didn’t even stay to engage with the content. In fact, 80% of them couldn’t make it past the first paragraph.
Rio:Hey Kenichi, you’ve been publishing daily articles on your SEO blog for almost 20 years now. Could you could share some pro tips with us on keeping readers engaged with your content.
Creating content that attract readers
Kenichi:Sure thing. Here are some tips for enhancing the UX of article pages. Firstly, Include relevant images and charts that visually engage readers: as I pointed out, people hate reading. Visuals can communicate more information than text alone. Our brains can also process visuals faster than reading text.
Kenichi:Next, use bullet points and numbered lists for easy scanning of key information: the eye can quickly and easily identify the individual points or items. It’s also effective to incorporate descriptive subheadings to orient readers: they help to make your writing more scannable.
Kenichi:Then, place engaged parts higher on the page: so visitors can find their desired content quickly. Last but not least, craft concise sentences that convey one main thought: long sentences may hinder readers from comprehending the meaning.
A/B Testing
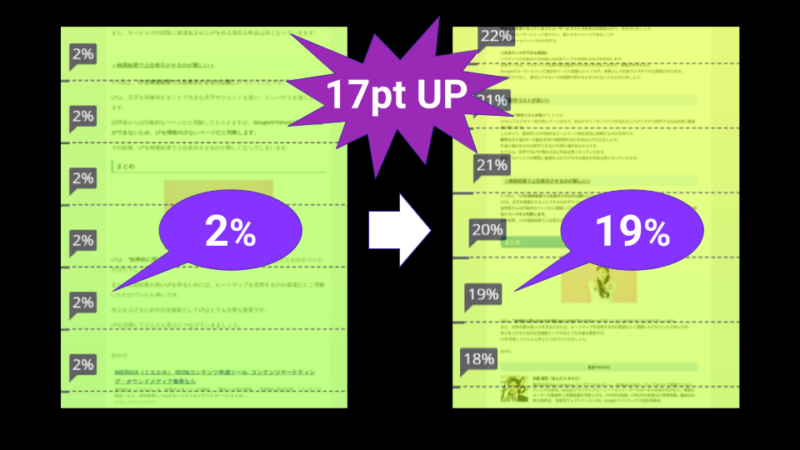
Rio:Back to our blog article, the high withdrawal rate above the fold wasn’t unique to the one article, but in fact, it was seen in most of the article pages on our blog. Which means that the content itself is less likely to be the villain here. There’s something common across all articles that might be causing this, I thought. So which common element was the villain? I hypothesized the side bar content, especially the ad banner is distracting the users from the main content and make them feel they’re in the wrong page.
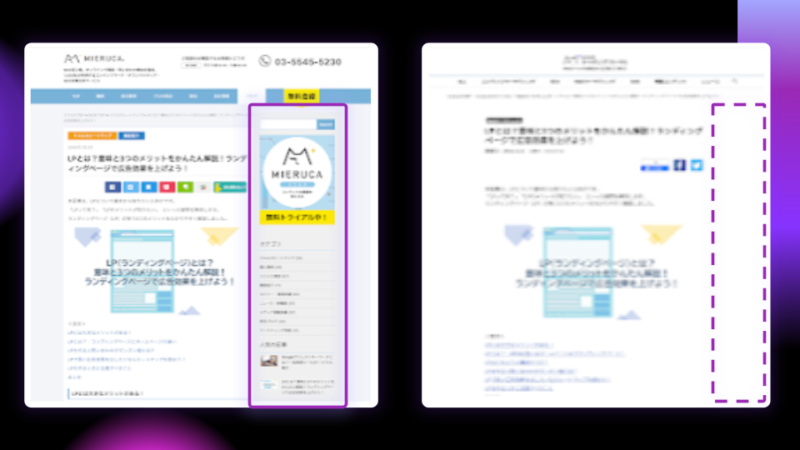
Rio:So we simply removed it. After this, the scroll rate went up like a skyrocket. Even at the very end of the article, about 20% of the users are now remaining as oppposed to 2% before.
Rio:Through compelling evidence and expertise, we have demonstrated the immense power of heatmaps to optimize UX, captivate users, and drive results. We hope you feel empowered to unlock the power of heatmaps at your organization.
Full Presentation from #brightonSEO2023
↓ Check out this video for full session ↓
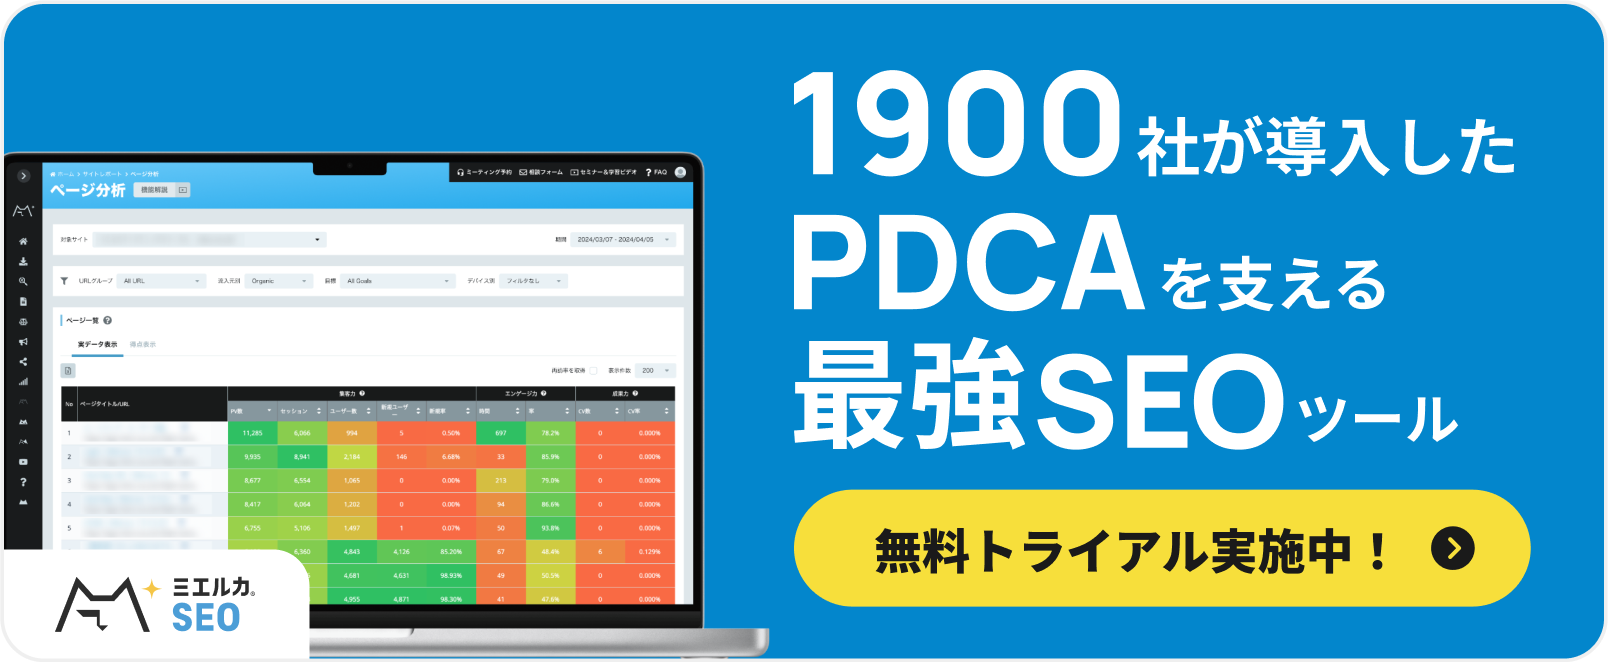
Mieruca Heatmap – Maximize Conversion on Your Website Fast.

Uncover opportunities to drive conversions, boost engagement, and bolster retention with the “Mieruca Heatmap” – a user behavior analytics and conversion rate optimization tool you can start using for free. Now featuring a no-code A/B testing capability, you can effortlessly validate design ideas that will spark higher conversions.
🔽 Start Exploring for Free – No Obligations 🔽
https://mieru-ca.com/heatmap/en/

株式会社 Faber Company 執行役員 Search Advocate(サーチ・アドボケイト)。「海外SEO情報ブログ」の運営者。正しいSEOをウェブ担当者に習得してもらうことをミッションに掲げている。検索関連のカンファレンス/イベントの取材やセミナーでの講師が Faber Company での主な役割。最近では、海外カンファレンスでの登壇も経験している。海外SEO情報ブログは、日本では、最も有名な SEO をテーマにしたブログの1つ。Google 公式ヘルプコミュニティのプロダクトエキスパートとして認定を受けており、Google 社員とのつながりも深い。
SEOコンサルティングの相談はこちら
X▶︎@suzukik

株式会社Faber Companyに新卒入社後、クライアントのCROコンサルティングに従事。その後自社のWebサイトのディレクションを担当し、1.5倍のCVR改善に成功。現在は自社ソフトウェアの開発マネジメントまで幅広く担う。
X▶︎@RiRiIchikawa Facebook▶︎市川莉緒


